
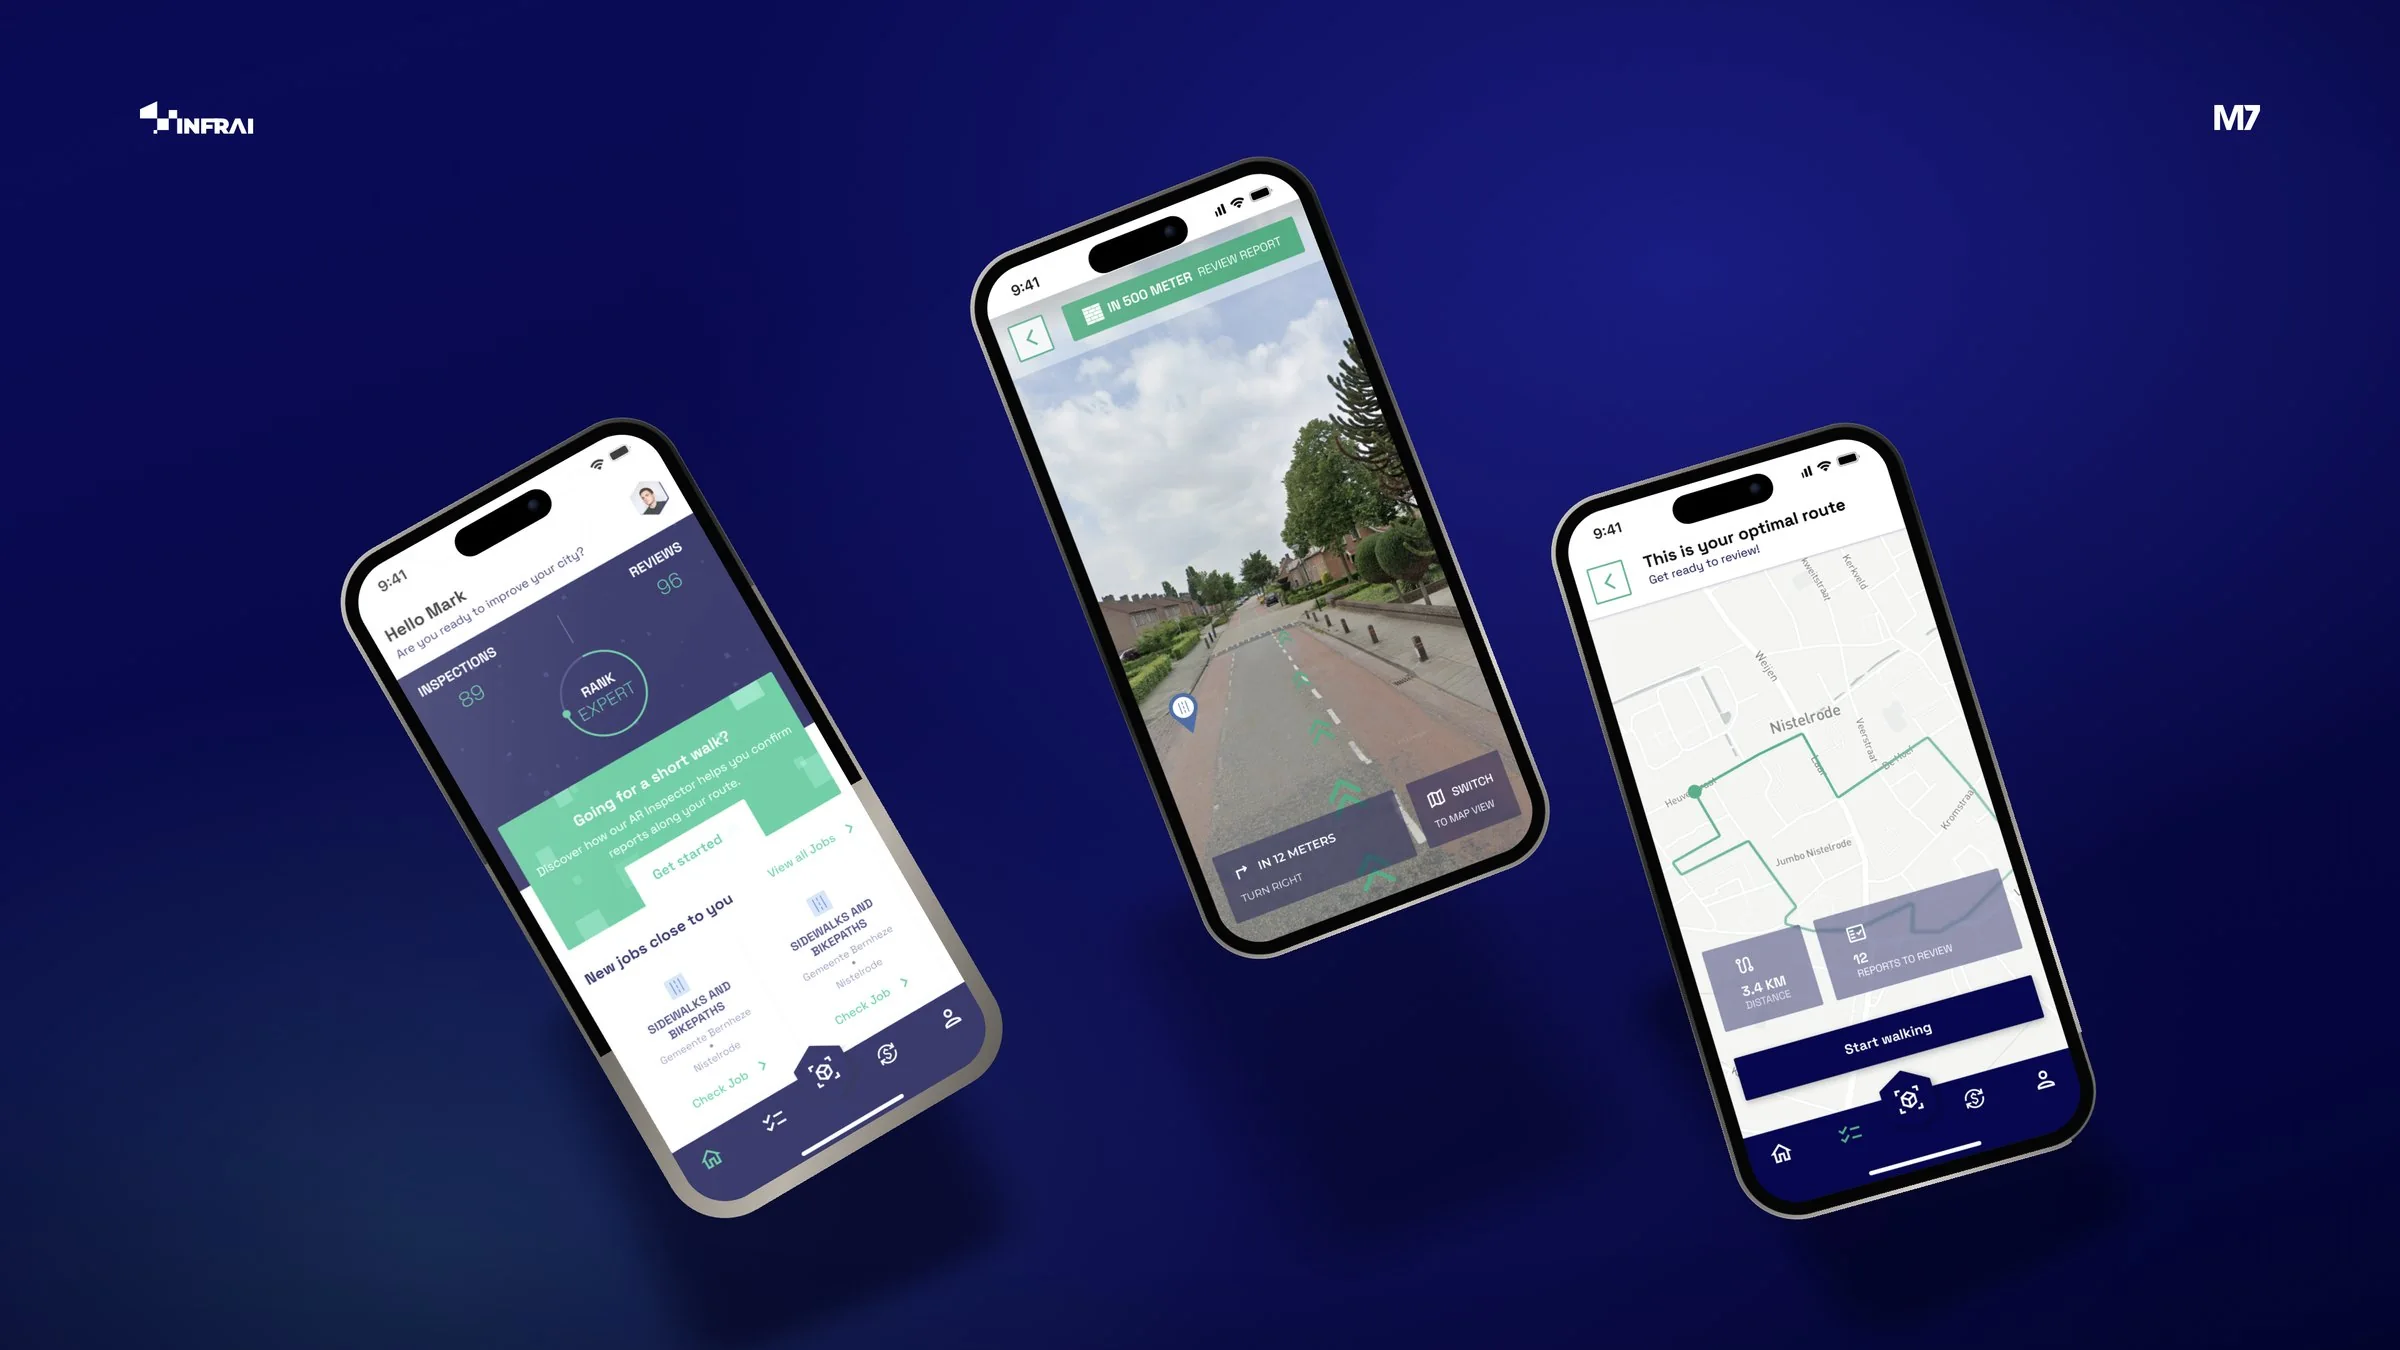








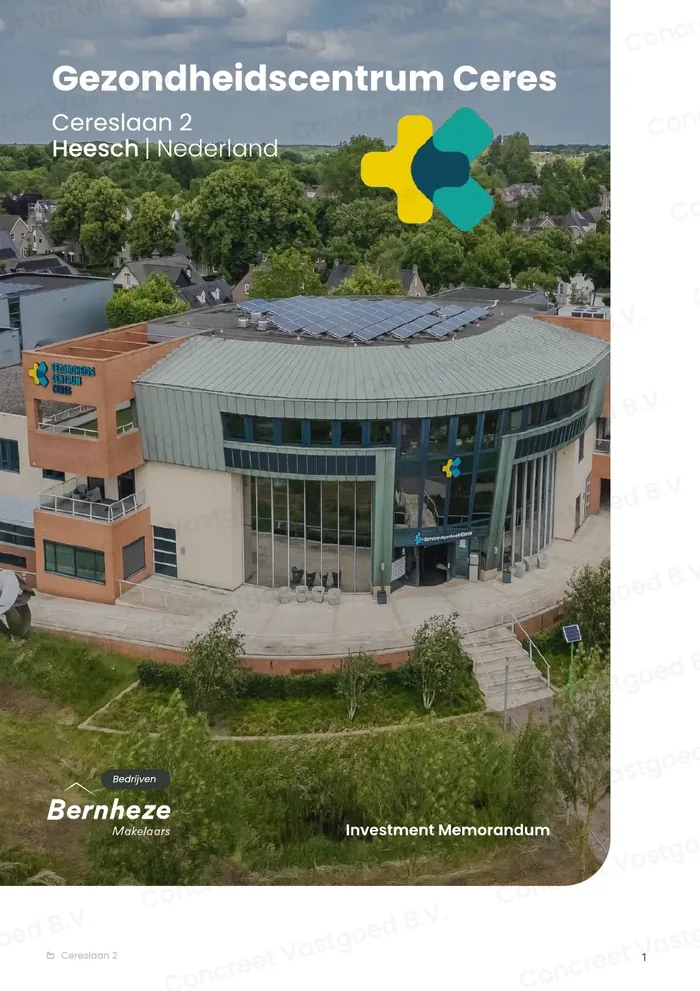
Numbers, processes and complicated stories become a lot clearer when you can see them. We design infographics, process visuals, charts and timelines for reports, presentations, websites and social media.
From data to insight
We start with the core question: what should the reader remember? Then we choose the right form, from chart and timeline to flow diagram or illustration, and cut everything that distracts. The result is a visual that is true to the data and instantly understandable.
One visual, many channels
An infographic works in an annual report, but also as a social carousel, in a blog article or as an animated video. We deliver variants per channel, so you invest once and can use the visual everywhere.
Why it works
Why it works.
Understandable
Complex information at a glance.
Shareable
Visuals people like to pass on.
Credible
Data presented accurately and clearly.
Tools & platforms



How much does an infographic cost?
A single infographic starts from a few hundred euros, depending on the amount of data and level of detail. A series in a consistent style or an animated version is more extensive.
Do I need to supply the data myself?
Yes, the content and figures come from you. We help structure them, ask critical questions where something is unclear and choose the form that tells the story best.
Do infographics help with SEO?
They can help. A clear infographic makes an article more valuable to readers and is shared more easily. With good alt text and accompanying copy, the information also stays readable for search engines and AI.
Today may be the day to meet your strategic partner.




 Martijn, Noud and the rest of the team are ready for you.