






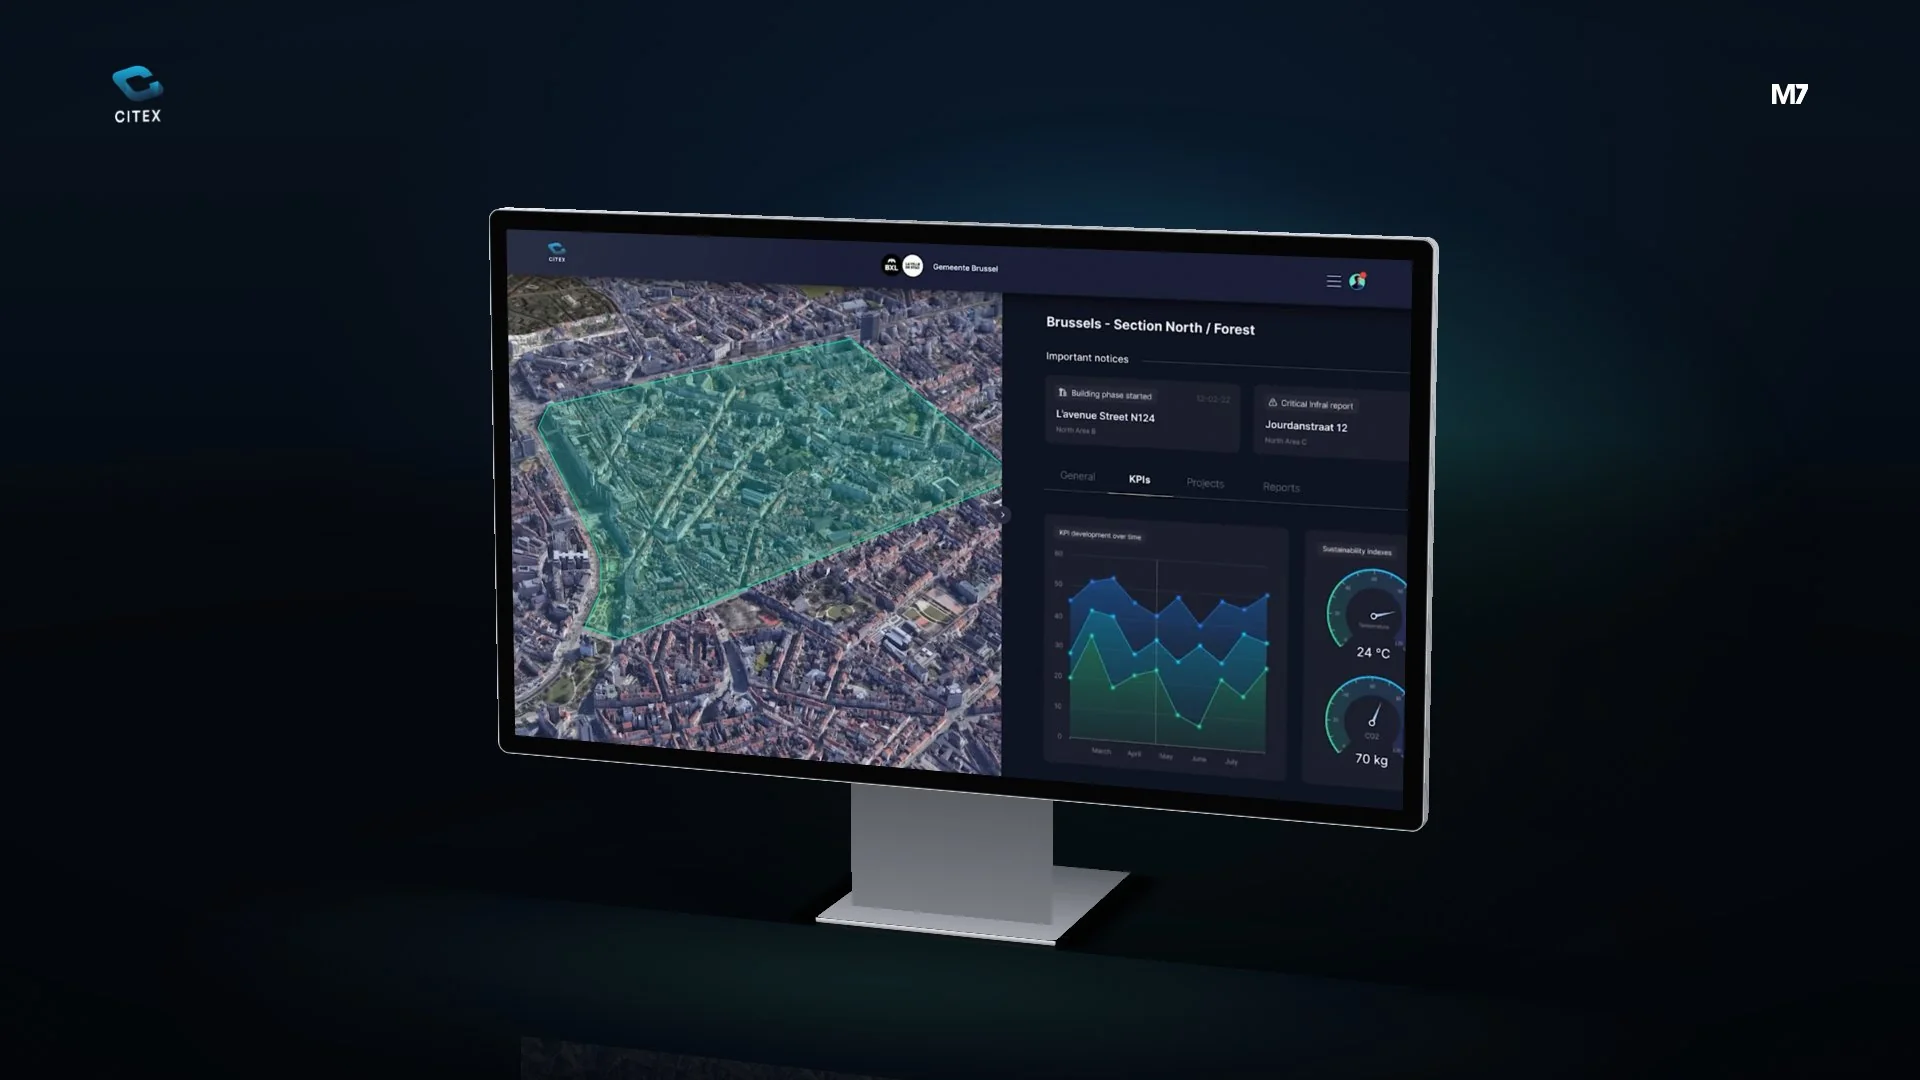
Dashboard design for Citex AI: per district, the KPIs and sustainability indicators next to a 3D map of the city, on a large screen and on a tablet.
- Client
- Citex AI
- Sector
- Tech, SaaS & Startups
- Applications
Citex AI brings together information about the city, area by area. It had to be readable at a glance: how is a district doing, and where on the map is it?
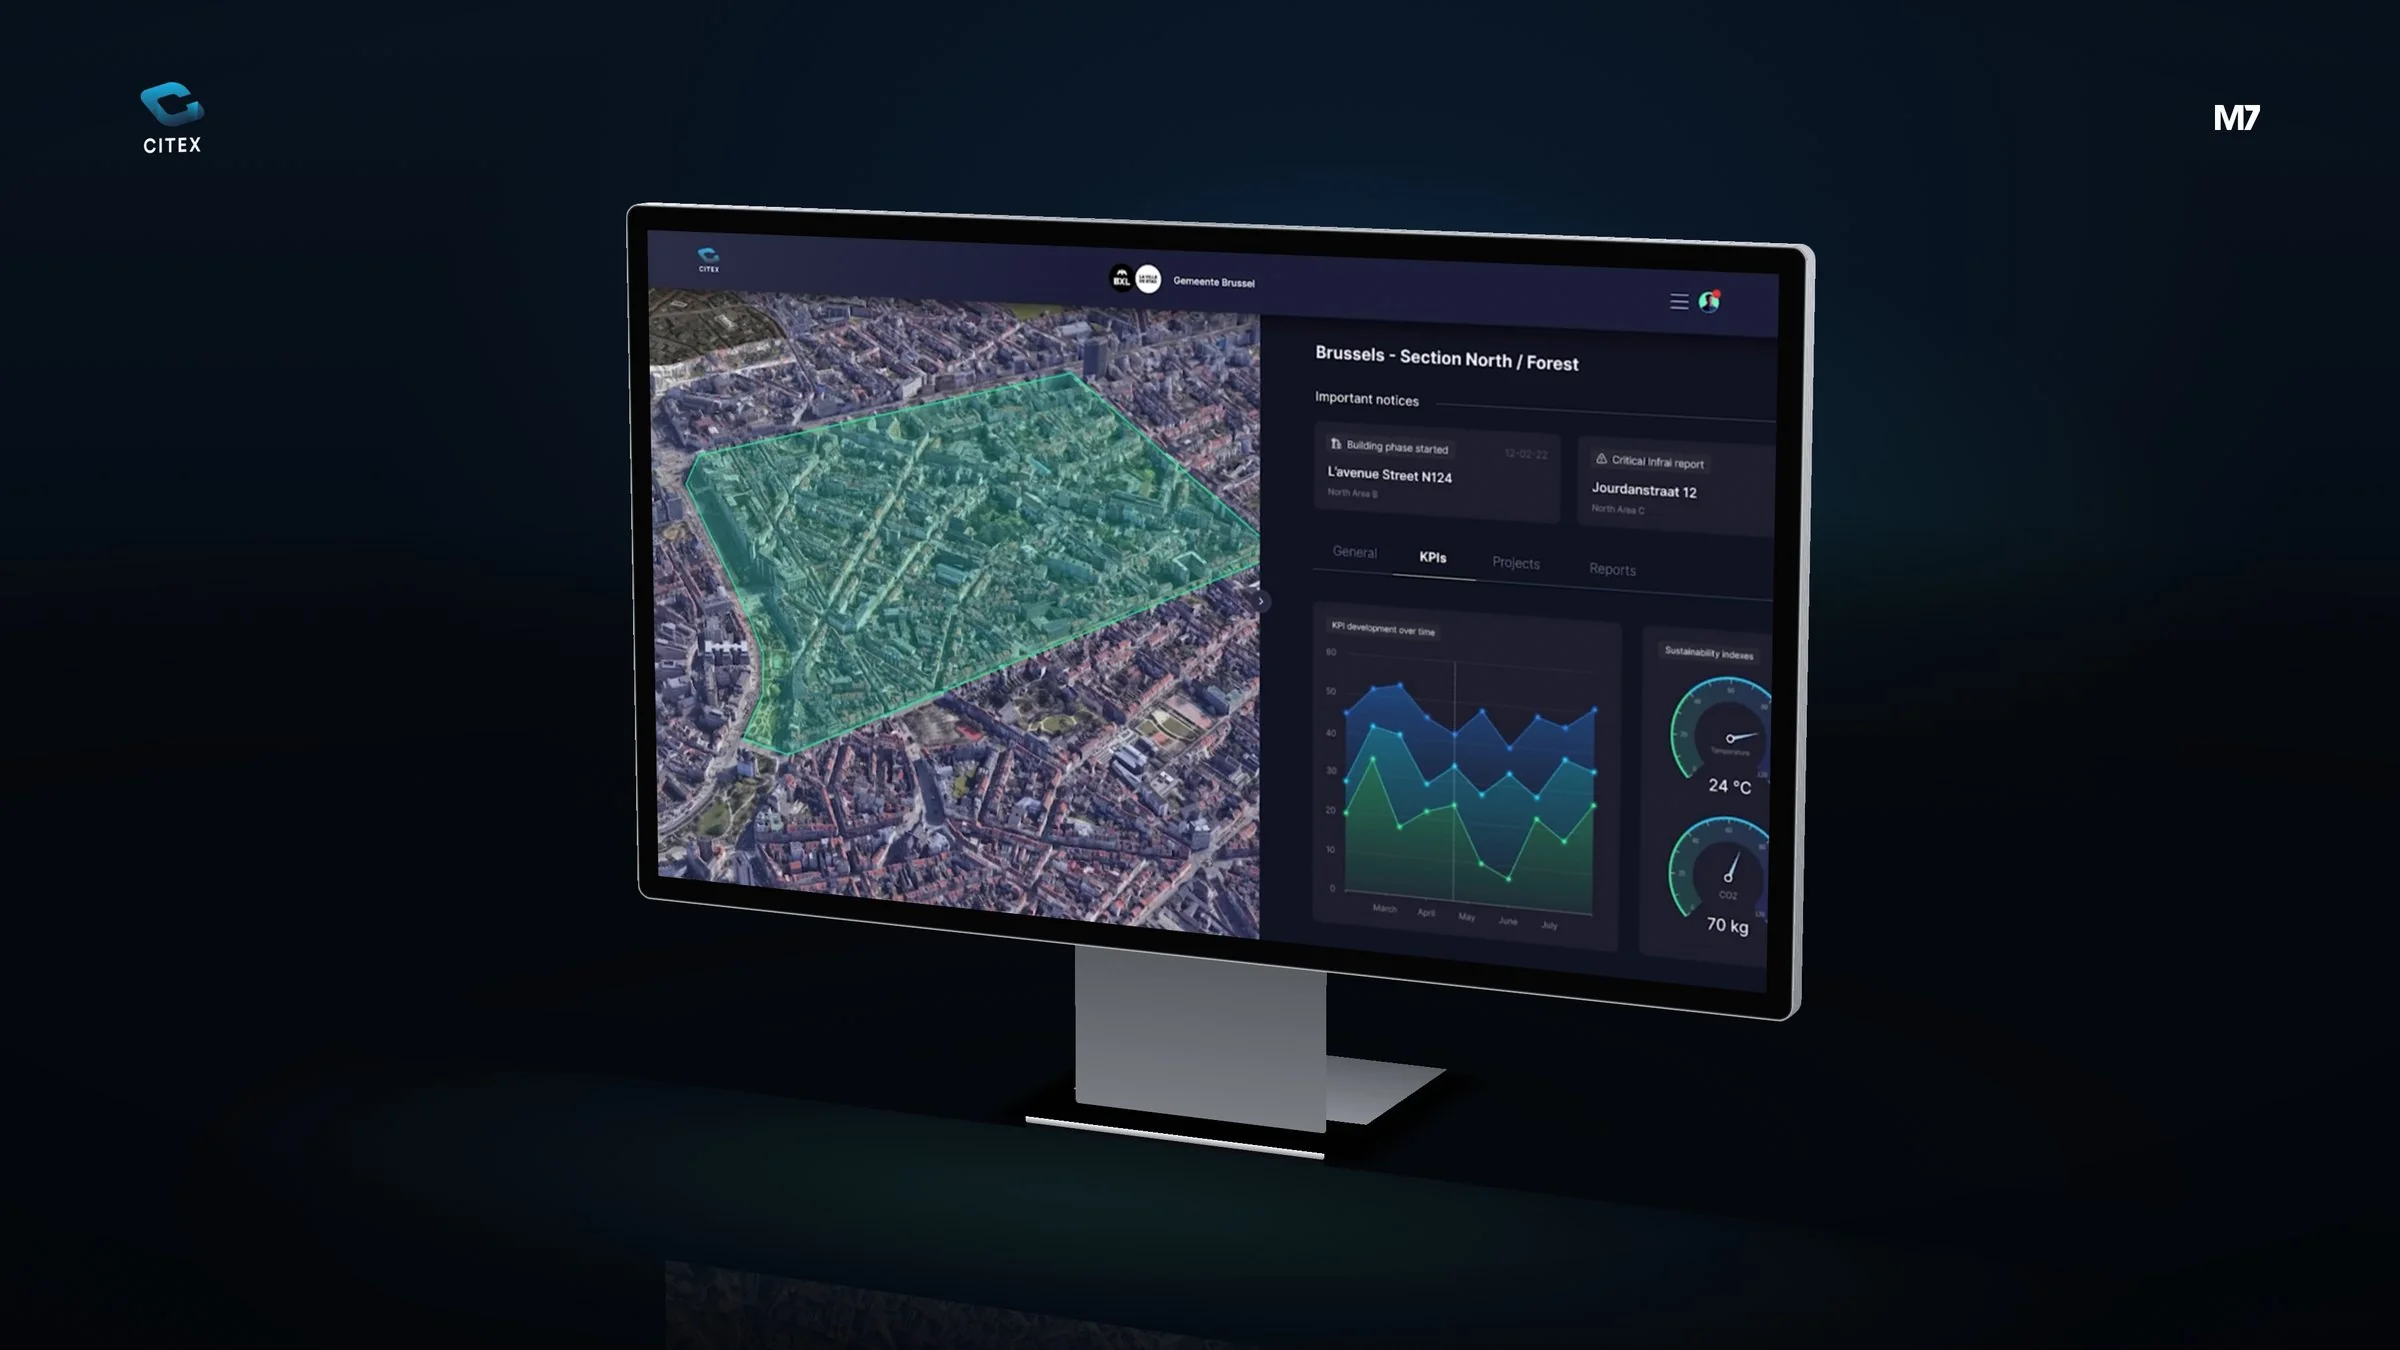
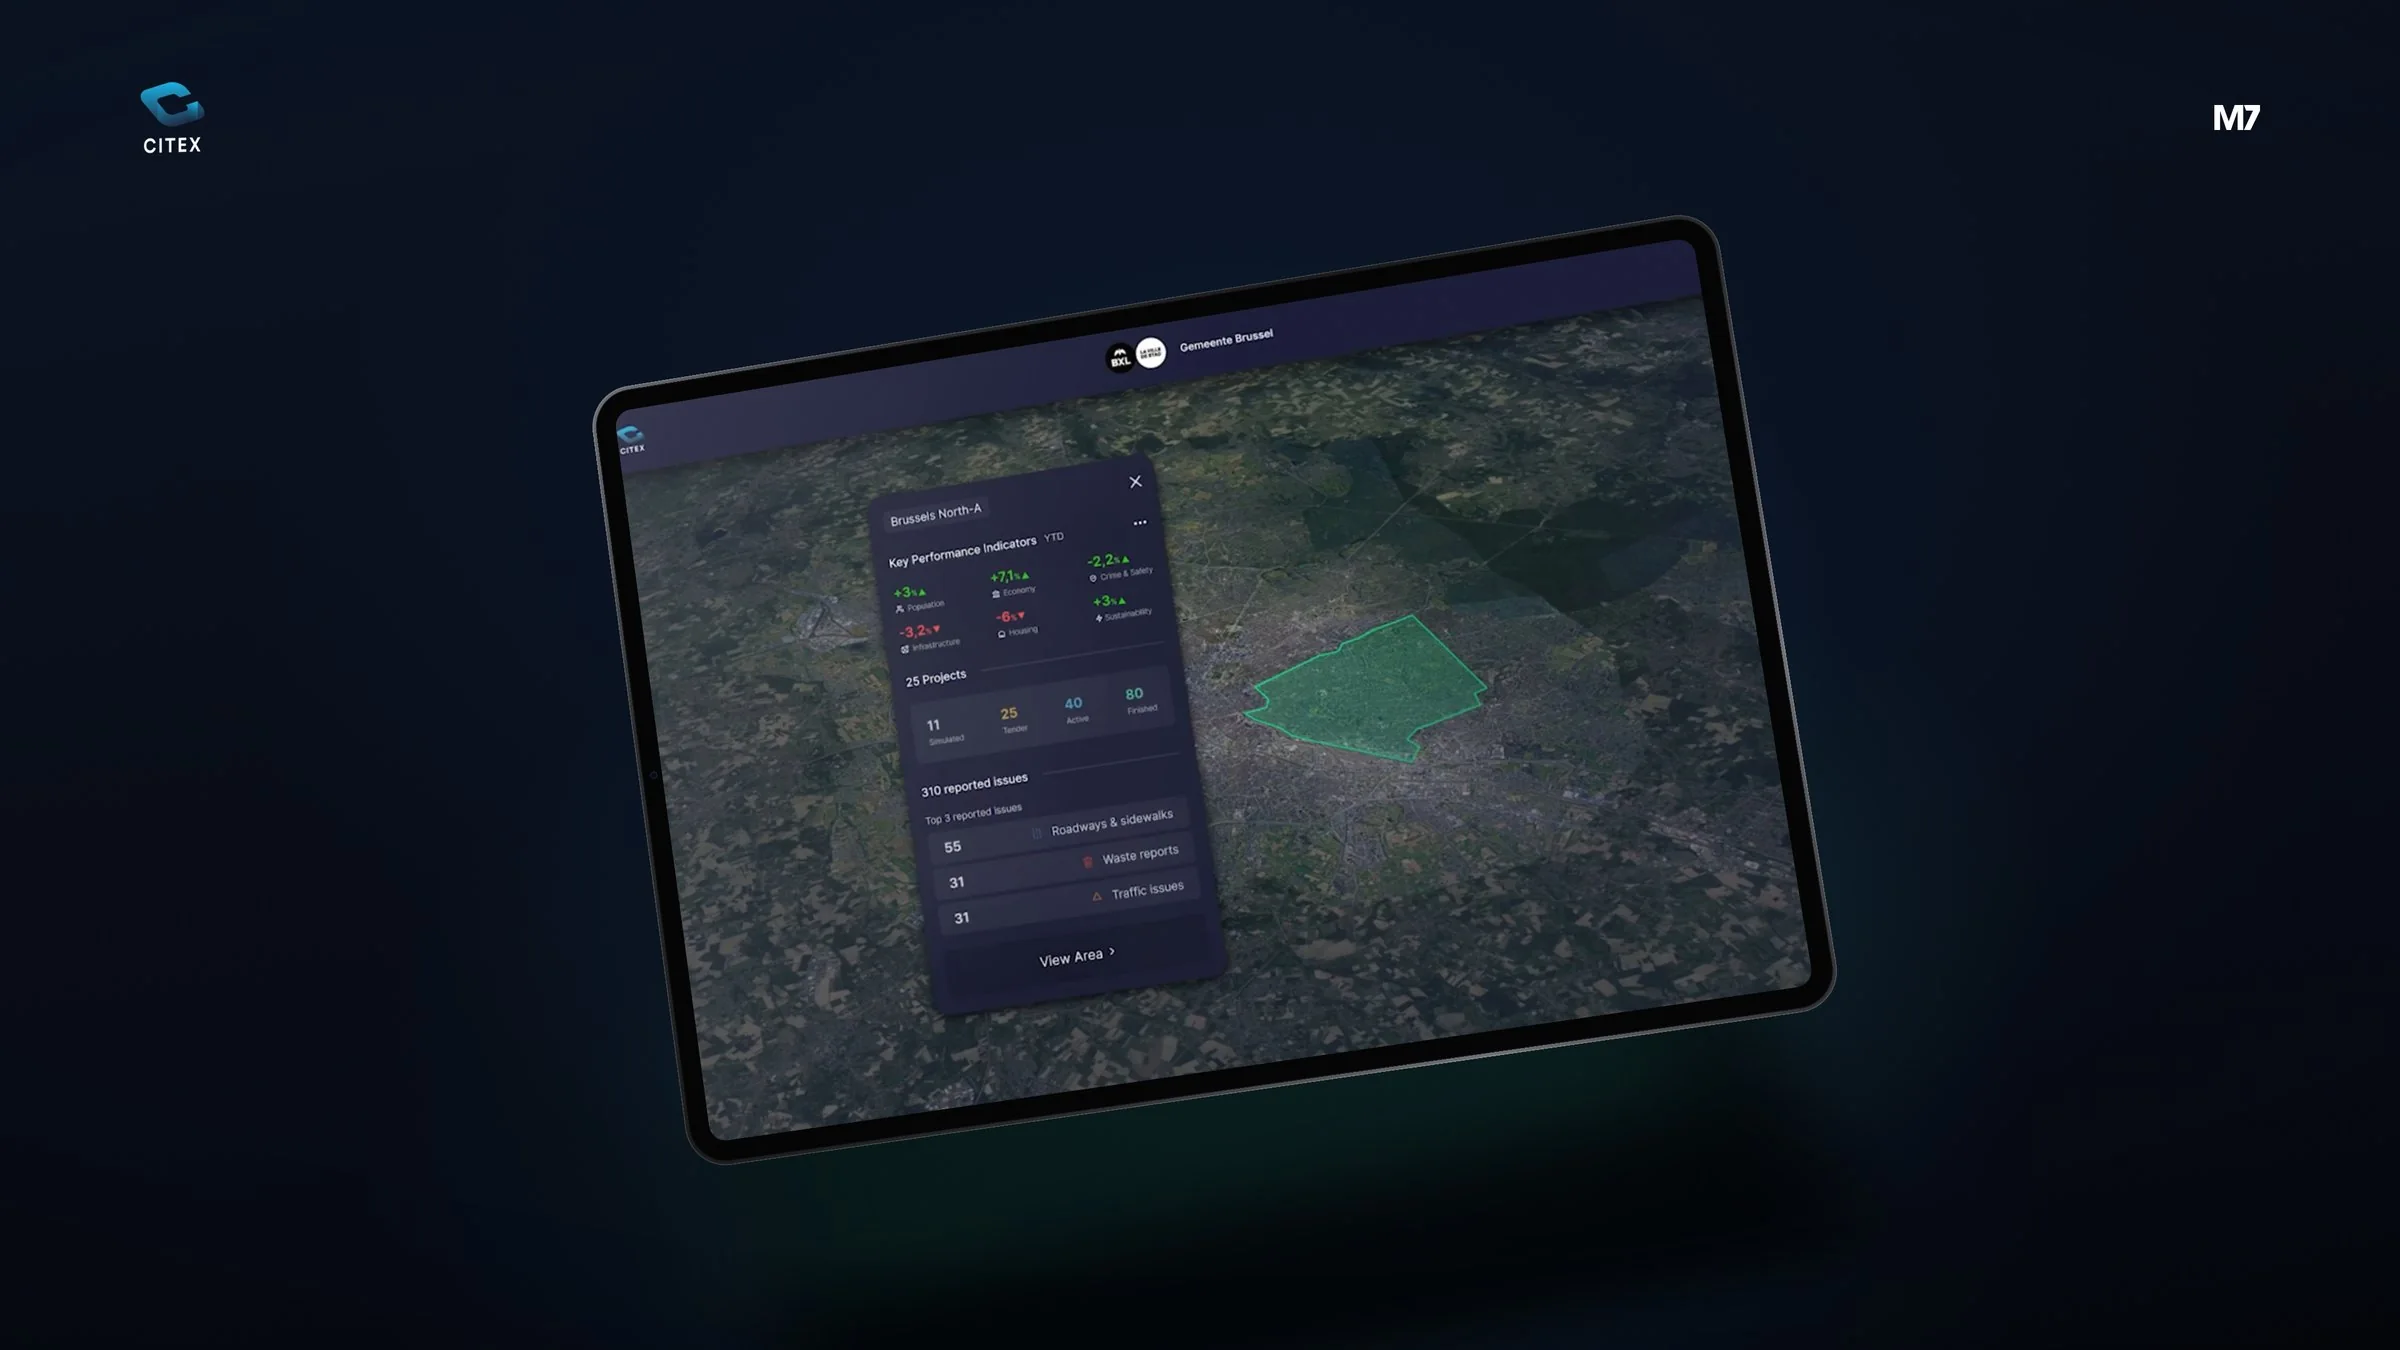
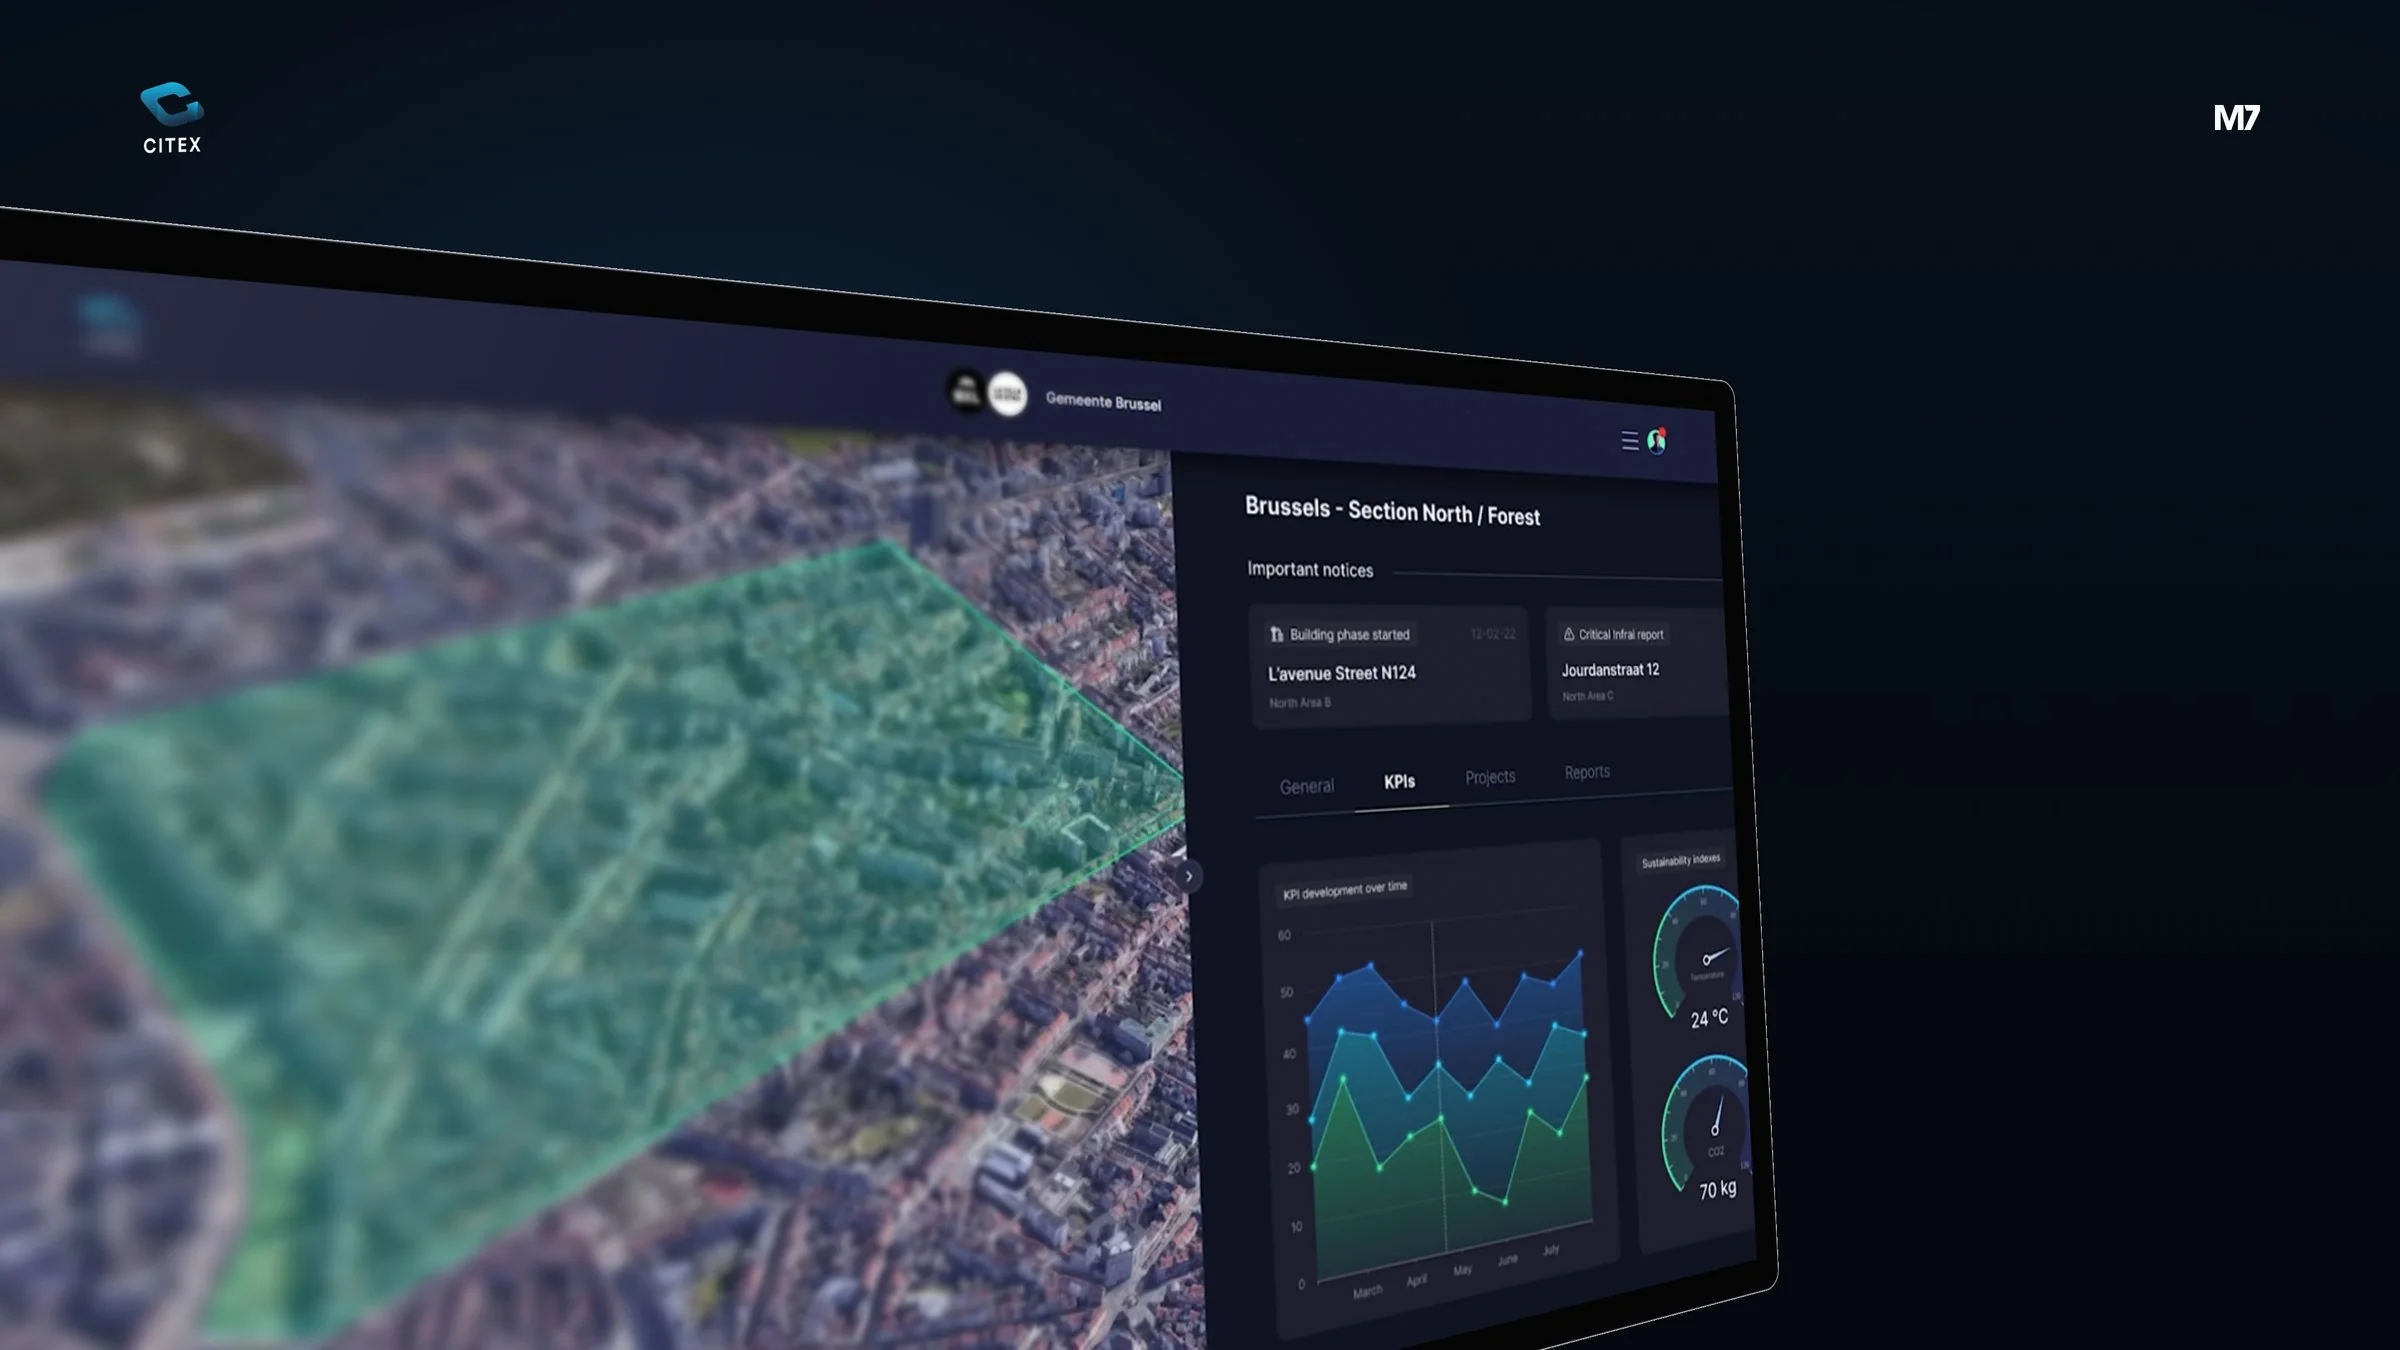
We designed a dark, calm dashboard around a 3D map of the city. For each area the KPIs and sustainability indicators sit right next to the map, so figure and place always belong together.
An interface that makes a lot of area data easy to read, on a large screen and on a tablet.
Today may be the day to meet your strategic partner.
Brand strategy & positioningLogo designVisual identityRebrandingBrand book & guidelinesNaming & taglineTone of voice & copyEmployer brandingBrand researchCompetitor analysisWebflow websiteWordPress websiteWeb shop (Shopify & WooCommerce)Landing pagesUX/UI web designWebsite migrationHosting & maintenance (web plans)Domain management, DNS & emailMultilingual websiteWeb accessibilityWCAG audit & accessibility statementPage speed & Core Web VitalsCookie compliance & Consent ModeCustomer portalSaaS platformMobile app (iOS & Android)Dashboards & internal toolsUX/UI app designMember portal & loyalty programmeAPI integrationsMVP developmentUX researchUser testing & usability testsUser stories & requirementsDevOps, CI/CD & monitoringMarketing automationEmail marketing & email flowsSales funnels & opt-insCRM implementationWorkflow automationLead scoring & nurturingTracking & analyticsConversion rate optimisation (CRO)Analytics audit & data checkSEO (search engine optimisation)Technical SEOAEO (Answer Engine Optimization)GEO (Generative Engine Optimization)Local SEO & Google Business ProfileLink building & digital PR
SEO content & copywritingStructured data & schema markupSEO auditContent structure & sitemapSocial media marketingGoogle Ads (SEA)Meta Ads (Facebook & Instagram)LinkedIn AdsTikTok AdsContent strategy & content calendarCopywriting & blogsCommunication strategyAudience research & personasCorporate filmProduct photographyDrone video & aerial photography3D visualisation & product rendersMotion design & logo animationLottie animations for web & appShort-form social videoAI imagery & AI videoBusiness cards & stationeryBrochures, magazines & annual reportsFlyers, posters & leafletsPackaging design & labelsTrade-show booths, signage & vehicle graphicsPresentations & pitch decksIllustrations & iconsInfographics & data visualisationProduct configuratorQuote & price calculatorProduct finder & quizCheck tools & quick scansBooking & appointment widgetInteractive website widgets & pop-ups3D configuratorAI chatbots & assistantsAI agentsAI integrations in your softwareAI strategy & roadmapAI workshops & trainingAI content productionDigital strategyIT project management & consultancyAgile working & scrumChange management & adoptionRoadmap strategyRoadmap managementDesign sprints & workshops
Launch your project today




 Martijn, Noud and the rest of the team are ready for you.